Interactive graphing and dynamic aggregation
Interactive Graphing supports dynamic service channel aggregation. When you specify a formula, the Build Formula button opens the Expression Builder screen with Advanced and Basic tabs. The white board on the Advanced tab supports dynamic syntax.
For details on dynamic aggregation, see UCE and dynamic aggregation. For details on formula syntax, see Using the formula builder to configure an advanced formula.
Note: The following examples are not realistic scenarios, but simple examples to illustrate the functionality's behavior.
Example: On-the-fly Aggregation
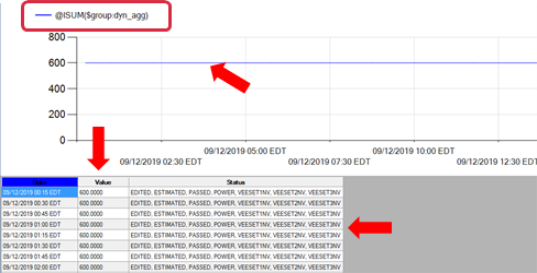
In the following example, there are three interval service point channels:
- SPC#1 – values of 100, reading status EDITED
- SPC#2 – values of 200, reading status ESTIMATED
- SPC#3 – values of 300, reading status POWER
The dynamic group contains these three service point channels. In Interactive Graphing, the function ISUM (Group) is applied to the dynamic group. The graph shows the aggregated values of 600, and the aggregated status EDITED, ESTIMATED, POWER.
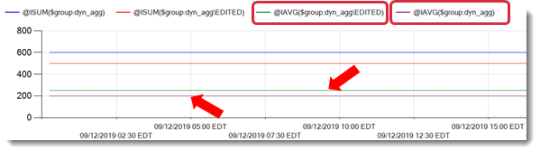
Example: With Exclusion Condition
In this example, an interactive graph has been generated with the ISUM function for a dynamic group. Intervals in service point channel 1 have that have a status of EDITED are excluded. The group as an aggregated value of 500 (200+300) and aggregated status of ESTIMATED and POWER. When you add the IAVG function to the report, the IAVG with the EDITED exclusion condition applied has a value of (200 + 300) / 2 = 250. (Without the EDITED exclusion condition applied, the IAVG would have a value of (100 + 200 + 300) / 3 = 200.
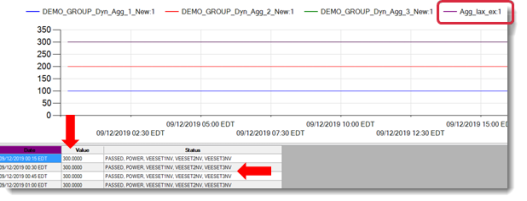
Example 3: Aggregation Task
In this example, a named formula, IMAX on dynamic group, is linked to a formula channel. The aggregation is run and the graph reports a result of MAX(100, 200, 300) = 300 from SPC#3, with reading status POWER.